Thursday 5 October 2023

How uninstalling SQL Server Integration Services (SSIS) can brick the SQL instance in your next patching window

Leaving the Integration Services SSISDB Database on a SQL instance after Integration Services has been removed can cause the SQL Database service to fail to start after the next SQL Server Cumulative Update installation.

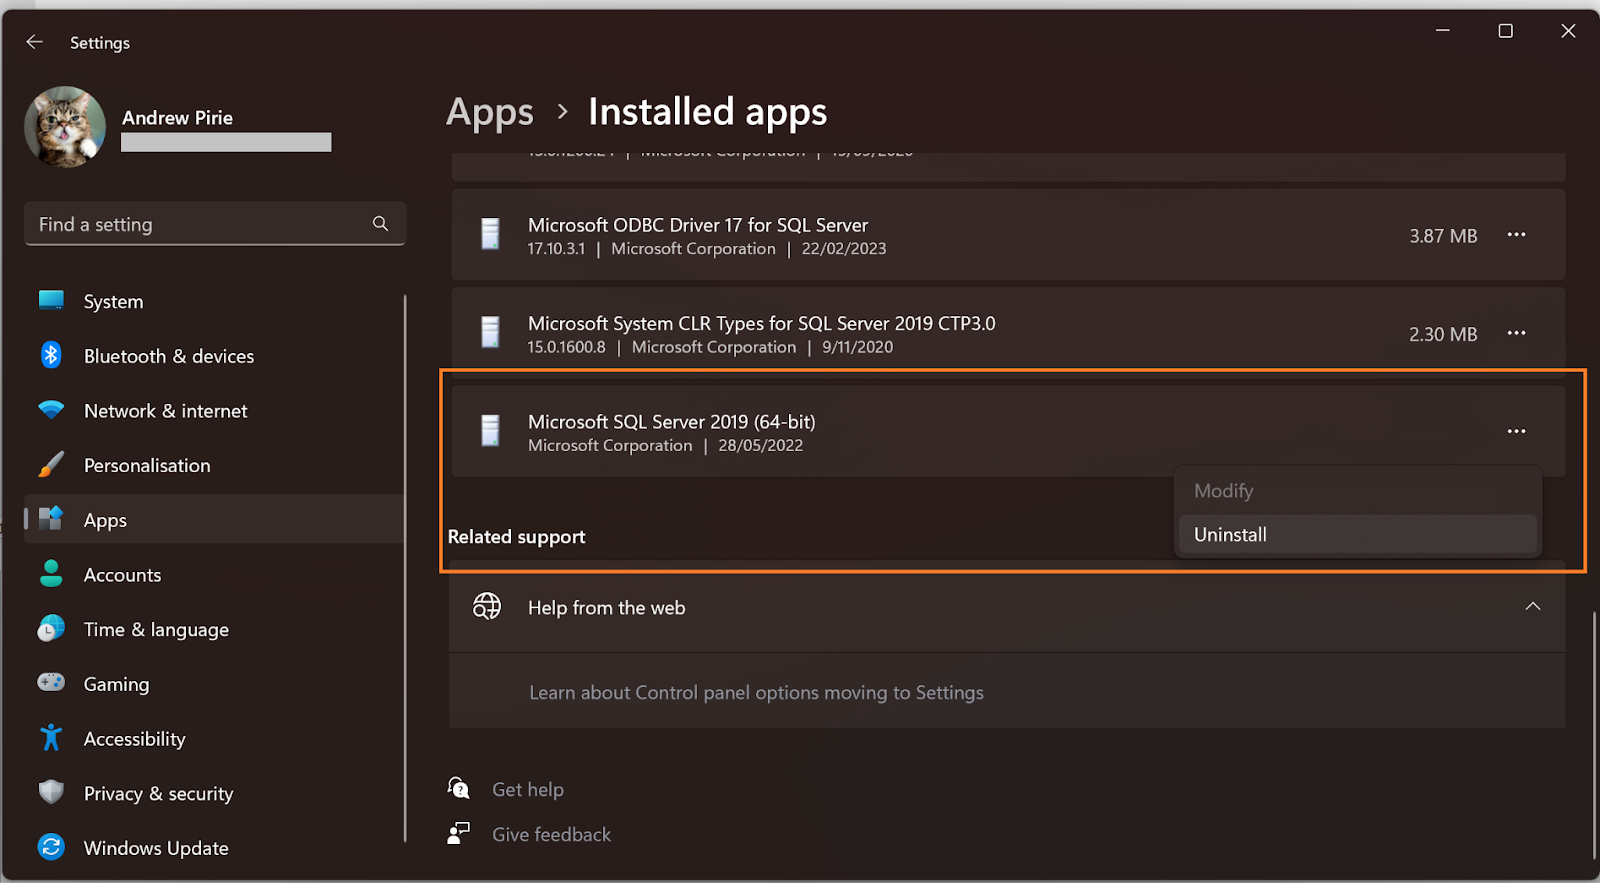
Uninstalling the Integration Services component through the Add / Remove programmes > “Microsoft SQL Server 20xx (64-bit)” Uninstall wizard, as encouraged by Microsoft here, will leave the SSISDB database present on the instance, setting the fuse for SQL startup failure and a late night support call in your next SQL instance patching window.


The feature removal wizard also leaves the logins, maintenance jobs, and any other components within the SQL Server instance.


Leaving the SSISDB database from an uninstalled Integration Services database on a SQL instance will likely prevent the instance from starting after the next SQL Cumulative Update installation due to the Cumulative Update post-install startup script attempting to upgrade the no-longer-installed SSIS component when it sees the SSISDB database.


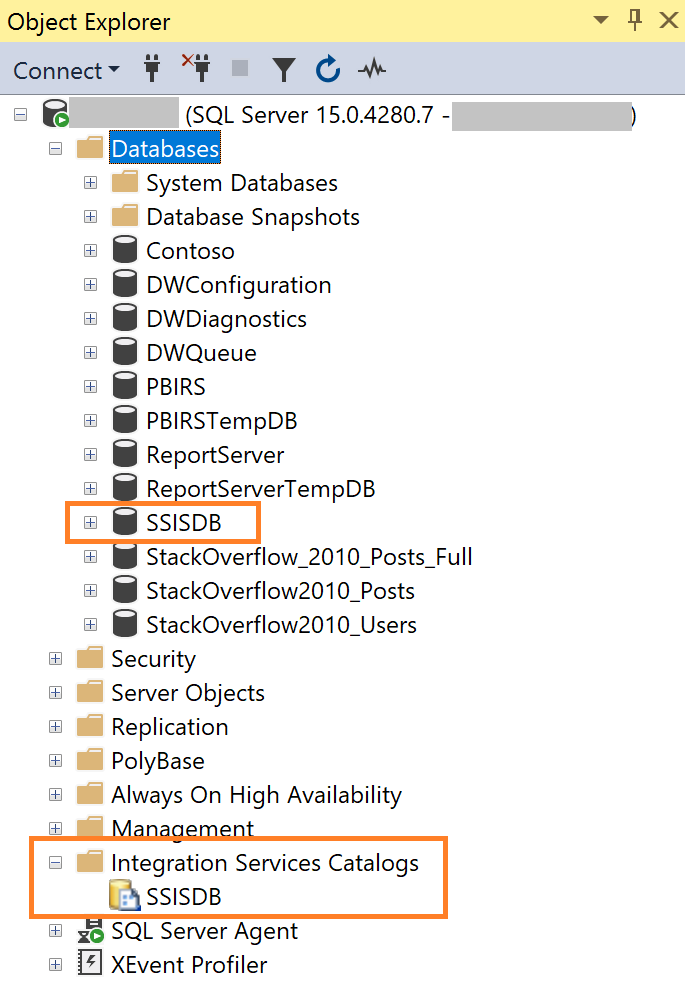
Here’s an example updating from SQL Server 2019 CU21 to SQL Server 2019 CU22 instance with a SSIS Catalog database (SSISDB) present. For reference, this catalog doesn’t contain any packages. This is a test catalog with no packages, but pretend all the packages have been removed ahead of uninstalling the SSIS feature for the purposes of this demo.


How to disable a SQL Database Instance while following the standard Microsoft processes

Do these steps without first removing the SQL Services Integration Services catalog, and your instance won’t start after a standard SQL Server Cumulative Update.

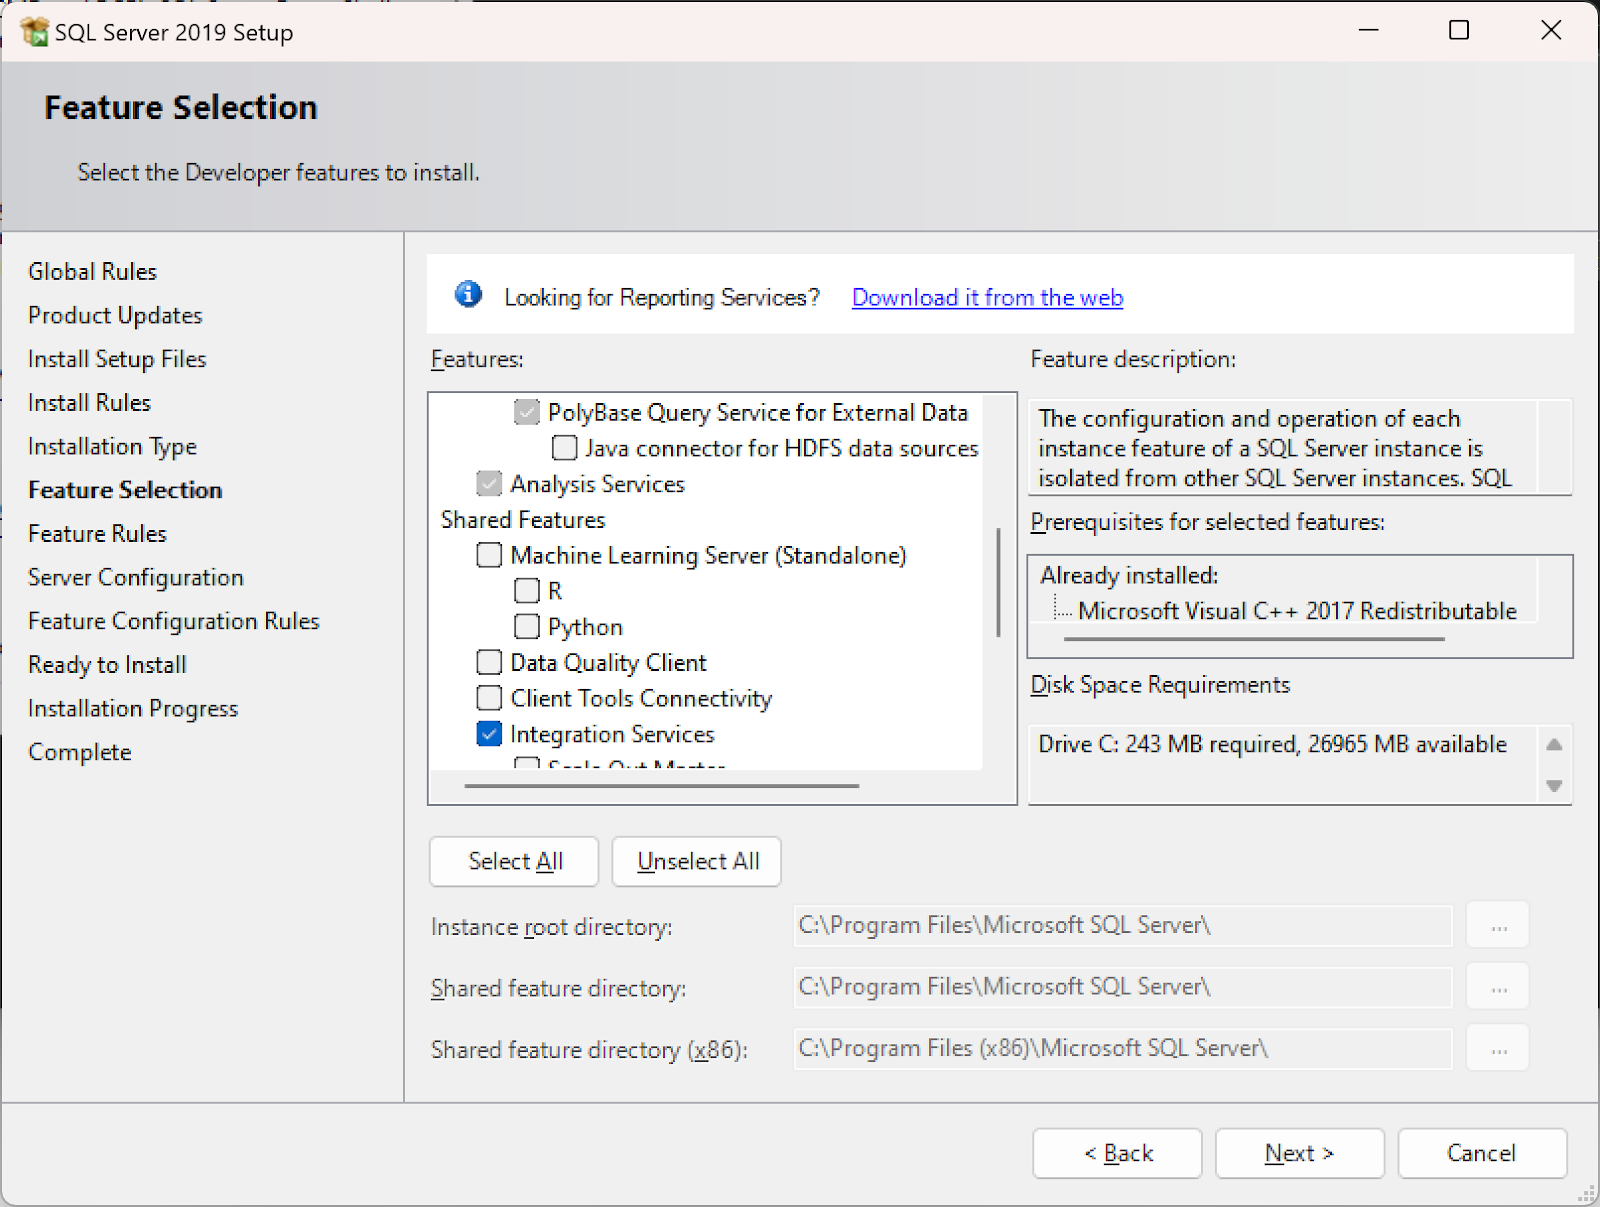
  1. Navigate to Add/Remove Apps and select to uninstall Microsoft SQL Server 20xx (x64-bit)

  2. Select the Remove option

  3. Select the instance to remove the Integration Services feature from

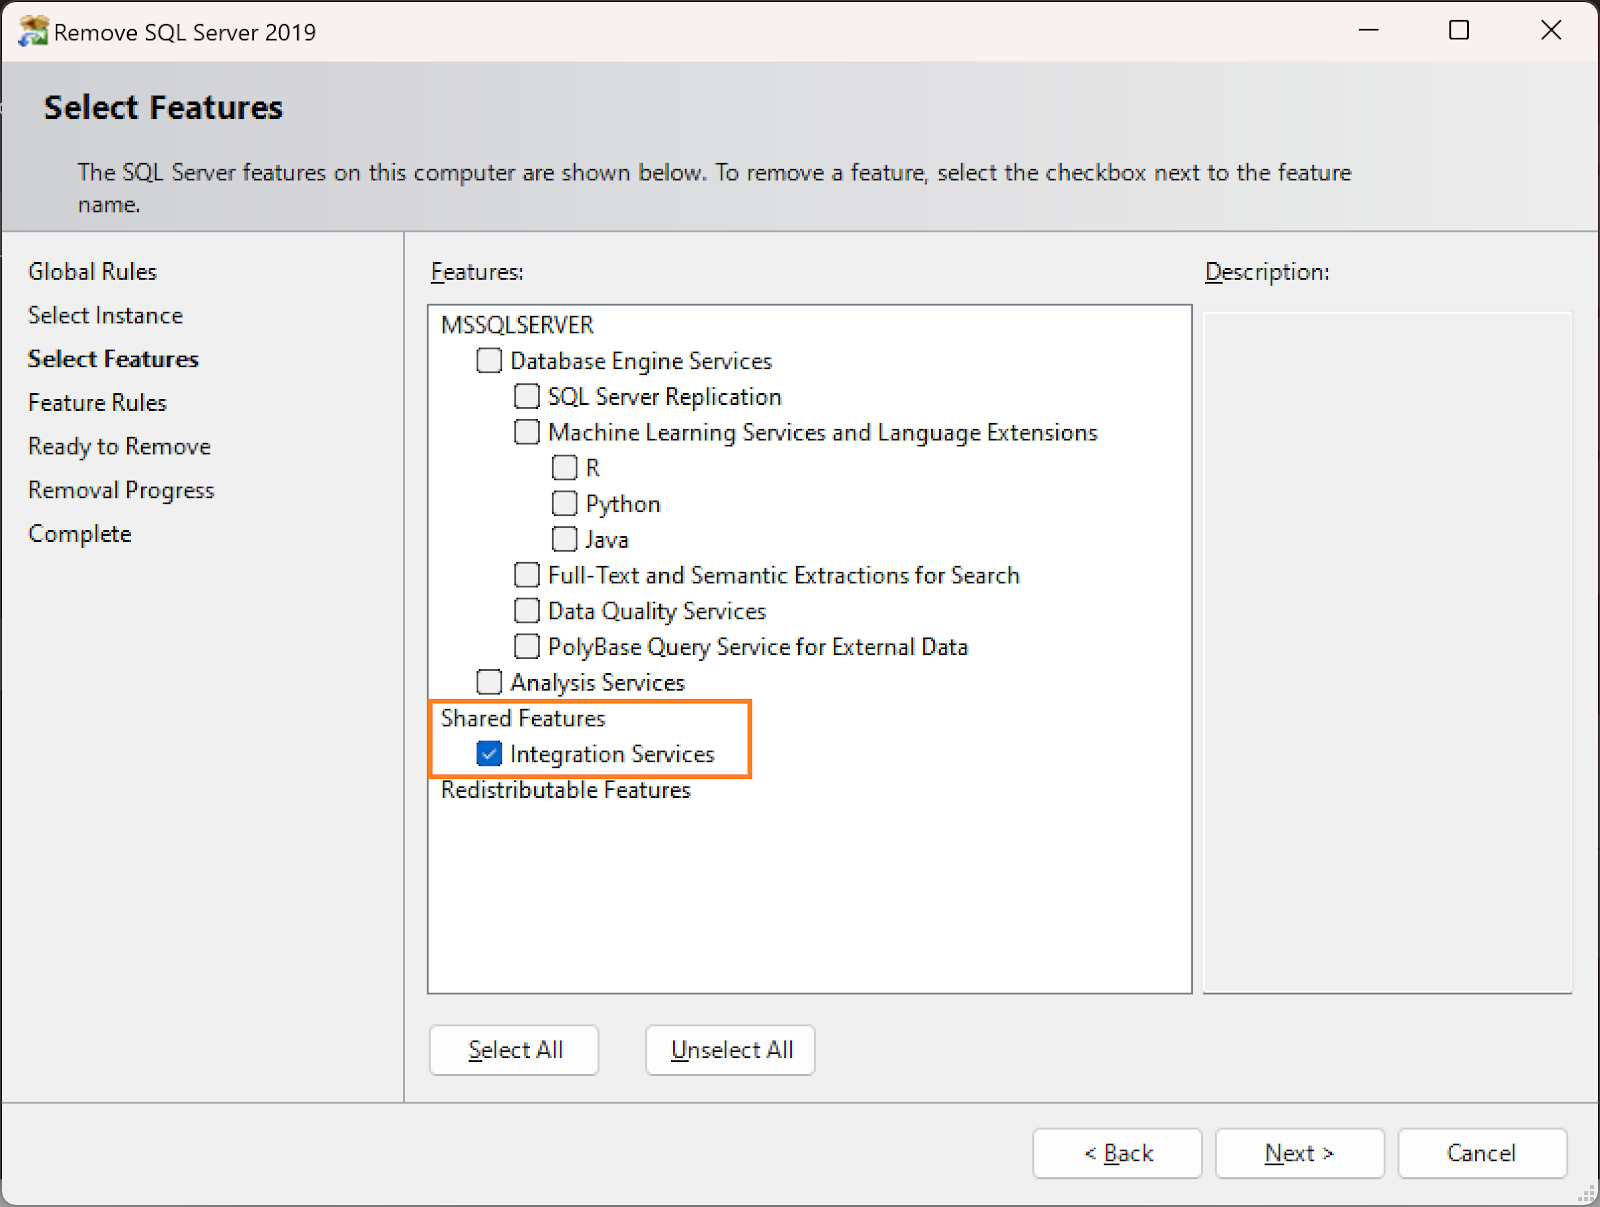
  4. Select to remove the Integration Services feature

  5. Select Remove to start the uninstallation of the Integration Services feature while leaving the other components installed.

  6. Close the feature installation wizard.

  7. Restart the server if you do that after making configuration changes.

Mission accomplished. All looks well. Book closed?

Now restart the server, and apply a Cumulative Update. If the Cumulative Update happens to include an Integration Services update, which may not be the one installed immediately after you uninstalled the Integration Services component, you’re in for fun.


  1. Install a Cumulative Update like normal. Here I’ve jumped a few updates, going from CU21 to the latest (CU22).
    The Cumulative Upgrade may fail or may report a failure. Either way, the SQL Database engine won't start.


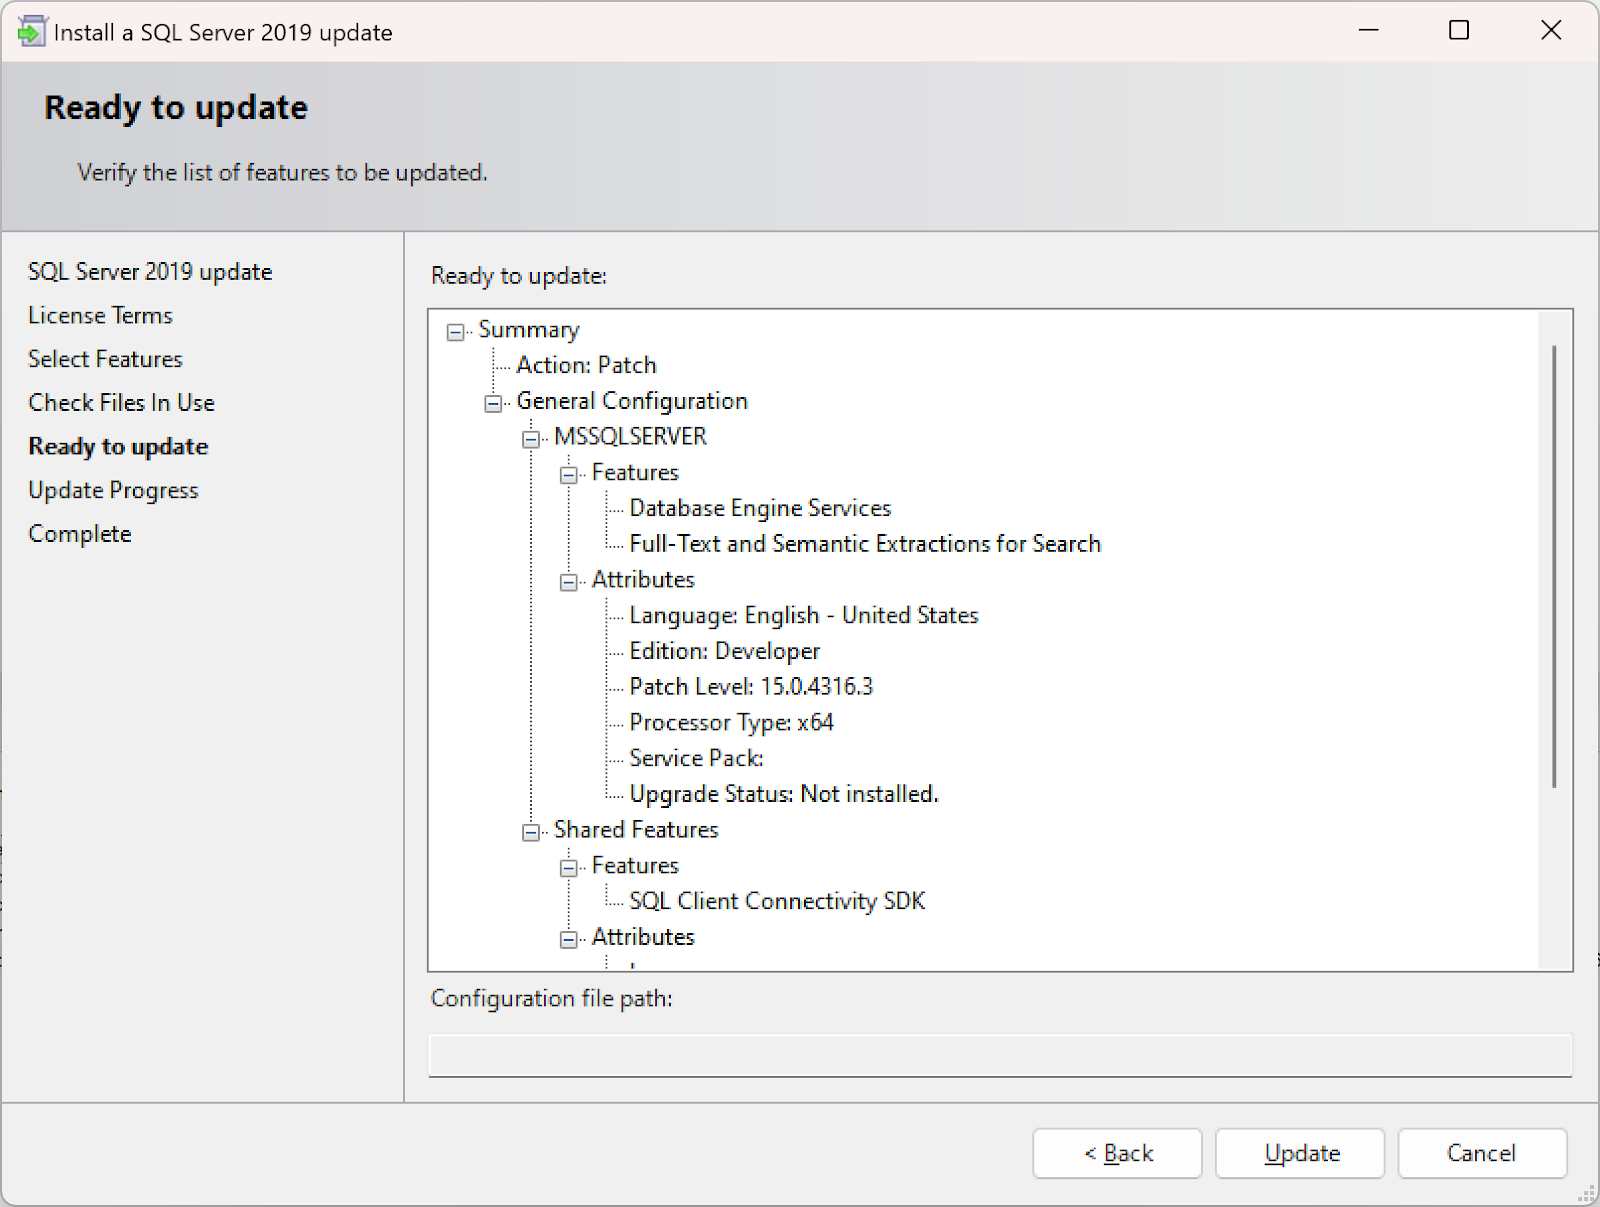
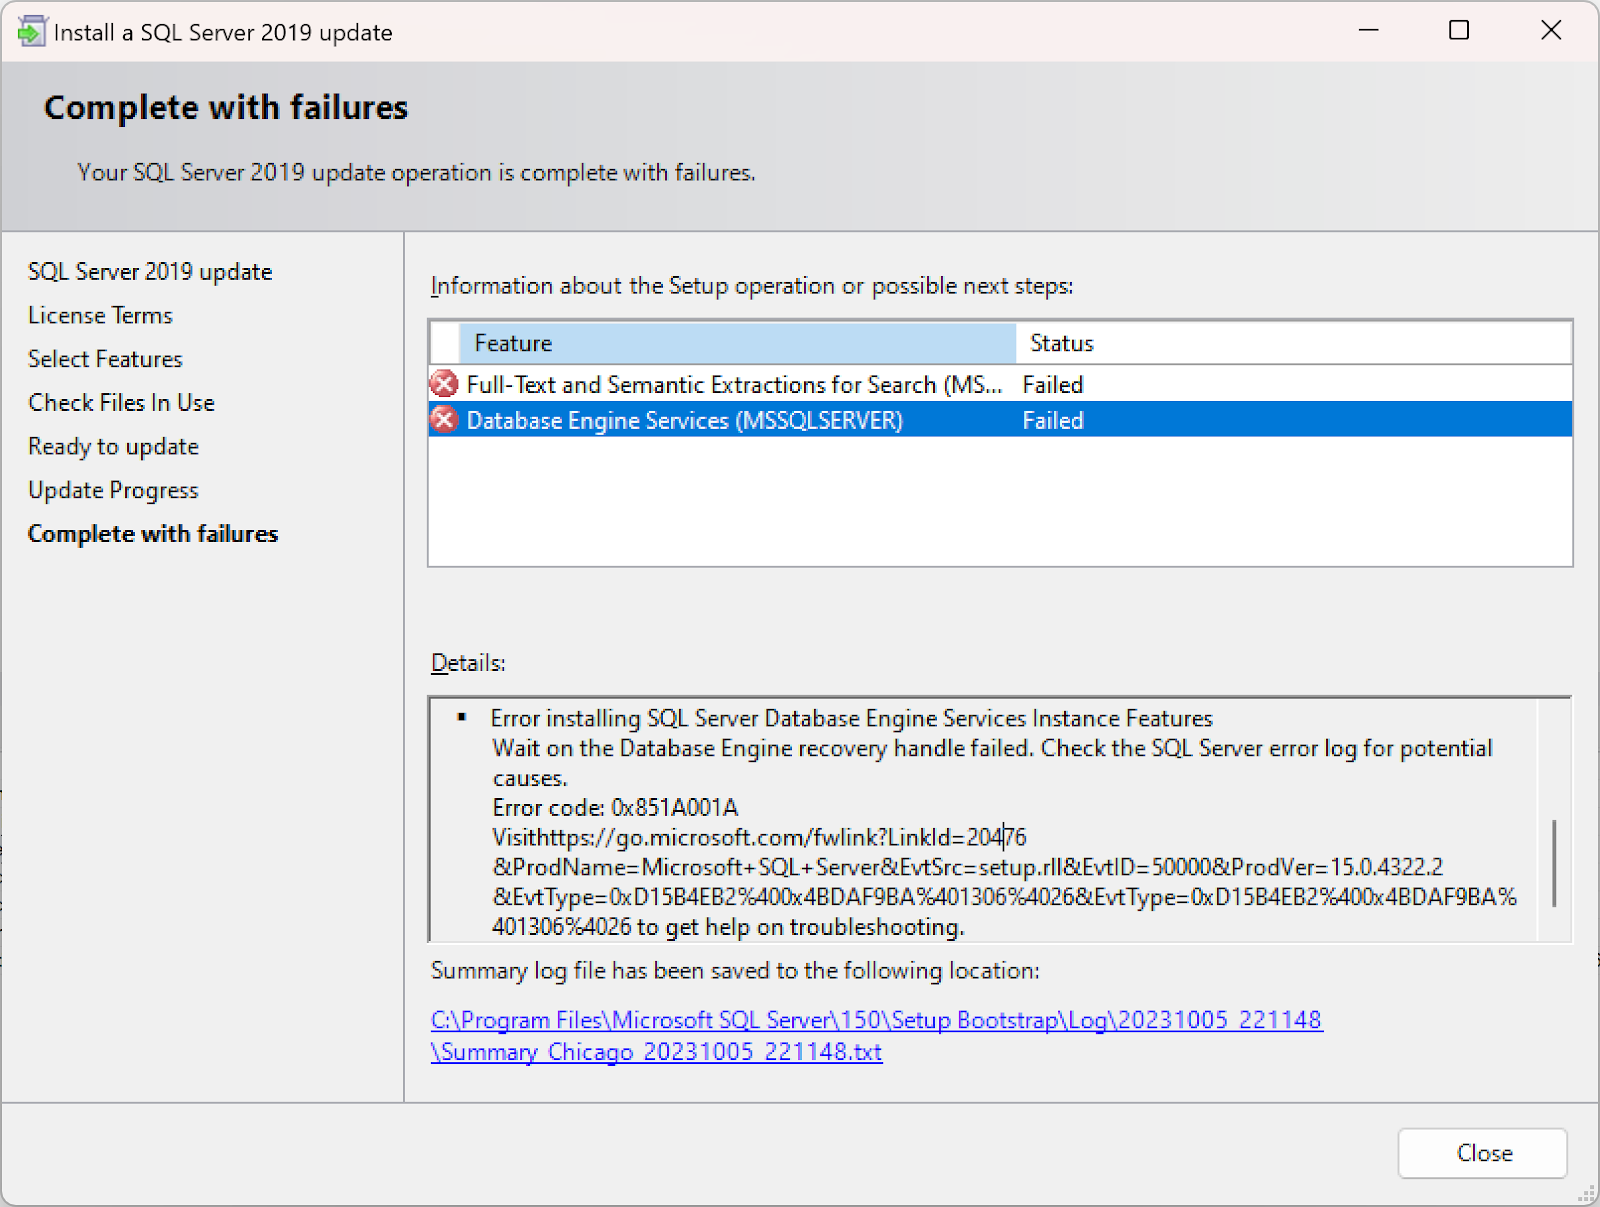
Here’s the Cumulative Update failure when updating from CU21 to CU22

Error details:

Error installing SQL Server Database Engine Services Instance Features

Wait on the Database Engine recovery handle failed. Check the SQL Server error log for potential causes.

Error code: 0x851A001A

Visithttps://go.microsoft.com/fwlink?LinkId=20476&ProdName=Microsoft+SQL+Server&EvtSrc=setup.rll&EvtID=50000&ProdVer=15.0.4322.2&EvtType=0xD15B4EB2%400x4BDAF9BA%401306%4026&EvtType=0xD15B4EB2%400x4BDAF9BA%401306%4026 to get help on troubleshooting


Here’s the behavior with the same process followed but updating from CU18 to CU22.

The SQL Server ERRORLOG file (under Program Files\Microsoft SQL Server\<Instance>\Log) ends with the following message:

2023-10-05 20:56:53.31 spid9s      Error: 3417, Severity: 21, State: 3.

2023-10-05 20:56:53.31 spid9s      Cannot recover the master database. SQL Server is unable to run. Restore master from a full backup, repair it, or rebuild it. For more information about how to rebuild the master database, see SQL Server Books Online.

This error occurs because a final piece in the Cumulative Update process is to restart the SQL Server Database service to run the database upgrade scripts for the build-in databases.


Attempting to SQL Server Database Service manually also fails, with the below error.


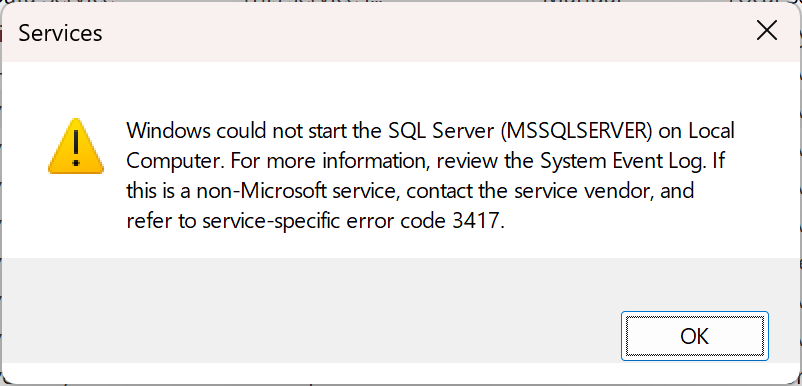
Re-checking the ERRORLOG file shows a repeat of the above “Cannot recover the master database” error.


The preceding steps give the key hint at why the master database script failed:


<standard database service startup logs>

Error: 18401, Severity: 14, State: 1.

Login failed for user 'NT SERVICE\SQLServerReportingServices'. Reason: Server is in script upgrade mode. Only administrator can connect at this time. [CLIENT: <named pipe>]

0 transactions rolled back in database 'SSISDB' (16:0). This is an informational message only. No user action is required.

Recovery is writing a checkpoint in database 'SSISDB' (16). This is an informational message only. No user action is required.

Parallel redo is shutdown for database 'SSISDB' with worker pool size [6].

Starting up database 'tempdb'.

The tempdb database has 8 data file(s).

The Service Broker endpoint is in disabled or stopped state.

The Database Mirroring endpoint is in disabled or stopped state.

Service Broker manager has started.

Database 'master' is upgrading script 'ISServer_upgrade.sql' from level 0 to level 500.

---------------------------------------------

Starting execution of ISServer_upgrade.SQL

---------------------------------------------


Taking SSISDB to single user mode

Setting database option SINGLE_USER to ON for database 'SSISDB'.

CREATE NONCLUSTERED INDEX [index_tasks_ReadyForDispatchTime] ON [internal].[tasks] ([ReadyForDispatchTime] ASC) INCLUDE ([CreatedTime], [CreateWorkerAgentId], [ExecutedCount], [ExpiredTime], [InputData], [IsCritical], [JobId], [LastUpdatedTime], [MaxExecutedCount], [Priority], [Status], [TaskType]) WITH (ONLINE = ON)

CREATE NONCLUSTERED INDEX [index_tasks_Status] ON [internal].[tasks] ([Status]) INCLUDE ([ExecutedCount], [ExpiredTime], [IsCancelled], [MaxExecutedCount], [WorkerAgentId]) WITH (ONLINE = ON)

The module 'prepare_execution' depends on the missing object 'internal.set_system_informations'. The module will still be created; however, it cannot run successfully until the object exists.

The module 'encrypt_data' depends on the missing object 'internal.create_key_information'. The module will still be created; however, it cannot run successfully until the object exists.

The module 'deploy_packages' depends on the missing object 'internal.deploy_packages_internal'. The module will still be created; however, it cannot run successfully until the object exists.

The module 'start_execution' depends on the missing object 'internal.start_execution_internal'. The module will still be created; however, it cannot run successfully until the object exists.

The module 'stop_operation' depends on the missing object 'internal.stop_operation_internal'. The module will still be created; however, it cannot run successfully until the object exists.

---------------------------------

Starting assembly upgrade

---------------------------------

Altering assemly [ISSERVER]

Attempting to load library 'xpstar.dll' into memory. This is an informational message only. No user action is required.

Using 'xpstar.dll' version '2019.150.4322' to execute extended stored procedure 'xp_regread'. This is an informational message only; no user action is required.

Error: 50000, Severity: 16, State: 127.

Cannot bulk load. The file "C:\Program Files\Microsoft SQL Server\150\DTS\Binn\Microsoft.SqlServer.IntegrationServices.Server.dll" does not exist or you don't have file access rights.

Error: 50000, Severity: 16, State: 127.

Cannot bulk load. The file "C:\Program Files\Microsoft SQL Server\150\DTS\Binn\Microsoft.SqlServer.IntegrationServices.Server.dll" does not exist or you don't have file access rights.


Creating function internal.is_valid_name

Error: 6528, Severity: 16, State: 1.

Assembly 'ISSERVER' was not found in the SQL catalog of database 'SSISDB'.

Error: 912, Severity: 21, State: 2.

Script level upgrade for database 'master' failed because upgrade step 'ISServer_upgrade.sql' encountered error 6528, state 1, severity 16. This is a serious error condition which might interfere with regular operation and the database will be taken offline. If the error happened during upgrade of the 'master' database, it will prevent the entire SQL Server instance from starting. Examine the previous errorlog entries for errors, take the appropriate corrective actions and re-start the database so that the script upgrade steps run to completion.

Error: 3417, Severity: 21, State: 3.

Cannot recover the master database. SQL Server is unable to run. Restore master from a full backup, repair it, or rebuild it. For more information about how to rebuild the master database, see SQL Server Books Online..


At this stage, you have a SQL Server instance that won’t start. Using the command line parameters for minimal, single-user mode (-f -m) don’t help. 


Every time the SQL Server Database Services starts, it attempts to run the database upgrade scripts, including the SSISDB database, which no longer contains the special loaded SQLCLR assemblies required to run SSIS - that feature is no longer installed.


Here's how to fix this.

To recover from this state and bring the instance back online, re-install the SQL Server Integration Services feature from a SQL Server installation media as you would when adding a new feature. This will allow the SQL database service to start.

Note if you don’t have access to the installation media for the installed SKU, you should be able to use the Developer Edition media for this step.


Once Integration Services is re-installed, manually start the SQL Server service if it isn’t running, and re-connect using a client tool. If you get the message that the machine is in script update mode, wait for a while - in my test machine it took a couple of minutes - and try to connect again.


Once connected, expand Integration Services Catalogs, right-click SSISDB, and select Delete.


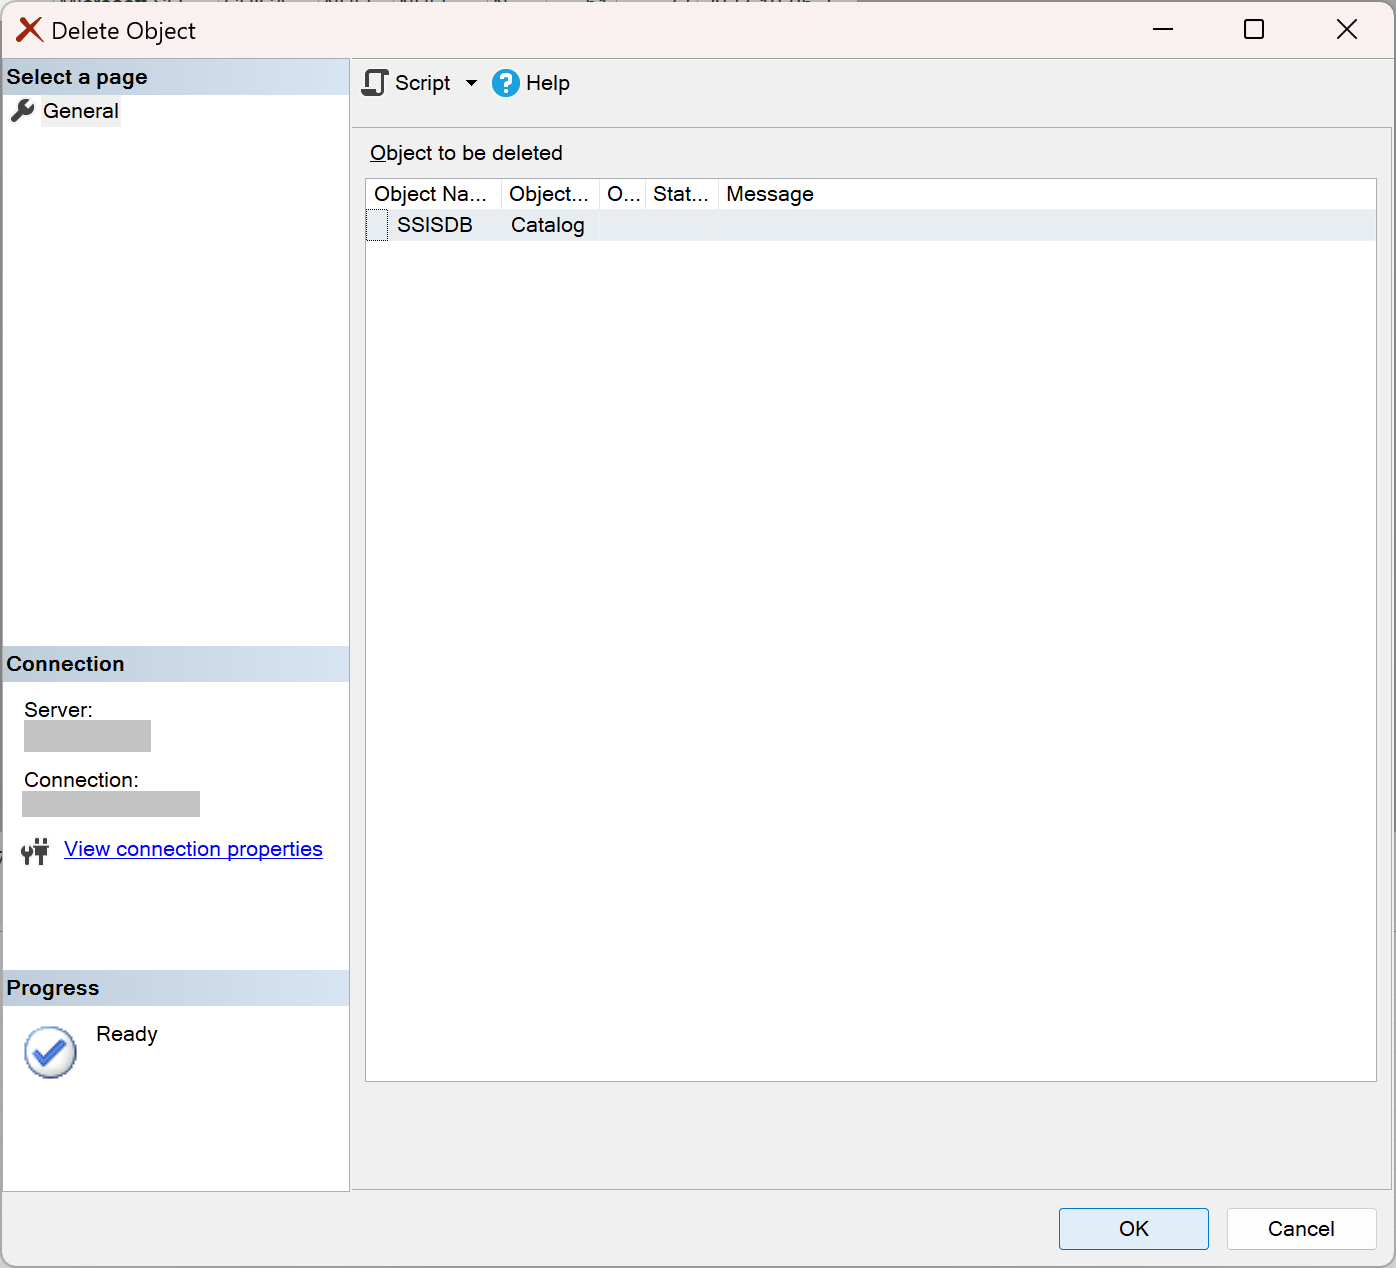
With the SSISDB catalog removed, you can safely uninstall the Integration Services component using the above steps. With the database removed, you can also have confidence that the next Cumulative Update experience will be smoother. 


Watching XEvent Profiler while the catalog is deleted via Management Studio, it does a few actions - removing any SSIS startup procedure, maintenance jobs, SQL logins for the maintenance jobs, drops the SQLCLR assemblies from the SSISDB database, and finally drops the SSISDB database itself. None of this happens when the feature is removed via the Control Panel > Add / Remove Apps > remove feature path, even if that path looks to be supported.

Tuesday 6 December 2022

How to Install the Power BI On-Premises Data Gateway to Windows Server Core, aka Windows Server without the Desktop Experience

The On-premises data gateway is not supported on Windows Server Core, and although it's worked well for me, it's unsupported and Premier Support may not be able to assist. This guide is intended for people who need to deploy a data gateway but are in the unfortunate situation of having installed the Server Core operating system.

It is possible to install the On-premises data gateway to Server Core via PowerShell scripts (the Add Gateway command), however it isn't currently possible to restore a gateway or add it to an existing cluster using the modules. 

The configuration tool appears to be the only way to do this, but the login process errors when attempting to sign-in to the configuration app for the On-premises data gateway. 

To successfully install and configure an On-premises data gateway on Windows Server Core (tested on Windows Server Core 2016 and 2022) follow the below steps.

1. Install Microsoft .Net 4.8 Runtime and Microsoft .NET 4.8.1 Runtime (both using the /q command line switch for quiet install, use taskmgr to see installation activity for the TiWorker processes. The .NET 4.8.1 installer does a server reboot). 

2. Install Microsoft Edge Enterprise x64 using the standard 64-bit MSI installer

3. Install the On-premises data gateway using the standard installer here. Using Windows Server 2016 it installed without issues, with Windows Server 2022 I needed to use the "-quiet" command line switch.

4. In command line, cd to "C:\Program Files\On-premises data gateway" and run EnterpriseGatewayConfigurator.exe - it should open as usual.


5. Enter the email to register the data gateway against and select Sign in options, then Sign in with my default browser.

Do not select Sign in yet, otherwise the below screen will appear stating Class not registered


This is caused by Server Core not having the default protocol handler for the https protocol, at least I wasn't able to get this to function. The login process tries to call the https://login.microsoftonline.com/... address directly from the command prompt, giving the above error.

6. Copy Procmon64.exe (Process Monitor from SysInternals / Microsoft) to the folder "C:\Program Files\On-premises data gateway" and rename it to cmd.exe

7. Start Process Monitor, for example by running C:\Program Files\On-premises data gateway\cmd.exe (so it starts logging activity).

8. Add a Filter in Process Monitor where Process Name is EnterpriseGatewayConfigurator.exe 


Note that the next few steps should be followed quickly afterwards, as Process Monitor is a heavy logging tool and leaving it running is likely to bring a server down.

9. Click Sign in on the On-premises data gateway configurator. It will try to launch the above cmd process using the cmd.exe found in it's local folder (actually Process Monitor) and give the error.

An error dialog will appear with the message with text Process Monitor: Invalid argument: /c. Do not close this. 


The configuration app is still active and spinning in the background, waiting for a successful login. The following steps workaround the login issues, and provide the login token to allow the Configuration Manager to successfully login.

10. Switch to the copy of Process Monitor started in step 7 that is logging activity.

11. Search for "login.microsoftonline" and find the "Process Create" row for our dummy cmd.exe. Double-click this row.


12. Copy the Command line: value from the dialog that appears, and paste this into a text editor. 

13. Remove the text before the "https://" ("C:\Program Files\On-premises data gateway\cmd.exe" /c start" ) and replace "^&" with "&" to remove the "^" carets.

This should give you a URL similar to the below, but where the xxxx's have actual guids.

https://login.microsoftonline.com/common/oauth2/v2.0/authorize?scope=https%3A%2F%2Fanalysis.windows.net%2Fpowerbi%2Fapi%2Fuser_impersonation+openid+profile+offline_access&response_type=code&client_id=xxxxxxxxxxxx&redirect_uri=http%3A%2F%2Flocalhost%3A49930&client-request-id=xxxxxxxxxxxxxxxxxx&x-client-SKU=MSAL.Desktop&x-client-Ver=4.46.0.0&x-client-CPU=x64&x-client-OS=Windows+Server+2022+Standard+Evaluation&prompt=select_account&code_challenge=xxxxxxxxxxxxx&code_challenge_method=S256&state=xxxxxxxxxxxxx&client_info=1

14. Close the active Process Monitor we copied this text from. Do not close the error message from step 9.

15. Paste and navigate to this URL in a web browser on any computer, and complete the login using the Microsoft account you intend to register the gateway against.

16. After signing in you will be greeted with an error page at a URL with a start similar to "https://localhost:xxxx/?code=..." - this is expected, copy this address.

17. On your Windows Server Core server, open Edge (by default this installs to C:\Program files (x86)\Microsoft\Edge\Application\msedge.exe), and paste and navigate to the URL.

You should be greeted with a page saying "Authentication complete. You can return to the application. Feel free to close this browser tab.". 


Close the browser, and return to the On-premises data gateway configurator. It should be successfully logged in. Continue to manage the gateway.


You will need to follow these steps to login every time you want to login to the gateway configurator, however this is not required for version updates or uninstalling the gateway components on a Server Core system.

Saturday 10 July 2021

Experience with the Power BI Visio visual

A couple of weeks ago I was given the opportunity to monitor a couple of sessions for Data Saturday ANZ. One of those sessions was Scott Helmer's talk Data in Context: Add Value by Embedding Visio Diagrams in Power BI Reports

Scott presented on the data capabilities in Visio, and how it can be integrated into Power BI. Visio has data fields behind the shapes in diagrams. It has good support for pulling in data from spreadsheets or CSVs, linking that data to shapes by an ID column, and refreshing the shape data fields from the external source. It also supports call-out text and conditional colouring. I wasn't aware of these features, they would be a great timesaver over manually updating the shapes in a floorplan when the situation changes. 

The other item Scott introduced us to was the Visio visual for Power BI. I was impressed with what he showed us, and thought it would be nice to get some experience with the visual. The most recent use-case I've had for Visio was a floor plan, and I had recently found this reddit post of a floor plan of the TV show The Office. I decided to overlay data over that floorplan from Power BI and went with two datasets – lines by character over each season of the show, and the average positive or negative sentiment of the lines spoken by each character (1 = positive, 0 = mixed or neutral, -1 = negative).

Introducing the visual
The Power BI visual has its own feature to support field mapping to shapes and allows you to add multiple fields from the dataset to the visual. Field values can be shown within shapes as shape colour, or text positioned in the shape.

I was surprised that data graphic conditional formatting isn’t updated in the Power BI Visio visual – instead the Power BI visual seems to see the Visio shapes as just shape map shapes, each with an associated ID. I had spent quite a while getting my Visio shape data graphics to look nice in Visio, then discovered that these could change based on my Power BI filters. Having those existing shape data callouts not updatable in Power BI seemed a missed opportunity.

The Power BI visual has good two-way interaction with other visuals in a Power BI report. When I select a slicer in Power BI, the linked Visio element is selected (highlighted by an green square around it) or filtered, depending on the Power BI visual interaction setting. Also, when a shape with an ID is selected in the visual, it acts as a filter for other elements on the Power BI report. This two-way interaction is what makes Visio lead over an alternative solution using Power BI shapes.

Filtering the Power BI Visio visual by selecting items, and using a slicer.

Usefulness of the visual

The floor plan overlaid with average sentiment rating of spoken lines, with a play slicer slicing on seasons gave an interesting view over the change in characters over seasons of the show, showing that there is usually one character who is more negative than positive in each season, switching between Angela, Phyllis, Toby, Kelly, and Stanley.

While viewing sentiment analysis aggregated at the series level, things stayed reasonably stable.  When increasing the level of detail to episode level it produced a more dynamic sentiment map. I guess this is a reminder that we all have good days and bad days.

Below is a GIF of the sentiment analysis changing per episode.

Floor plan of office sentiment, slicer on seasons and episodes, showing often-changing stats.


I was also surprised to see background characters present but with 0 lines during some episodes. I could have added rows indicating 0 lines so they still showed. It must be understated form of acting being one of these actors, just being present.

Perhaps creating a floorplan showing network traffic or active hours for each computer would be a real-world use-case. Use-cases that require displaying spatial relationships could also benefit from the visual.

Here is my use-case of the Visio visual acting as a filter for a more dynamic experience, showing an example positive and negative line from the character selected in the visual.

Filtering a character profile from a Visio diagram


What worked best for me
I had the most success when I leaned fully into the idea that “in the Visio visual, shapes are just a shape with an ID”, using the Visio visual’s “display as text” and “display as conditional colour” field settings instead of the shape data graphic features in Visio. 

The sentiment analysis page with shape text and colouring being mapped from Power BI is used in the above GIF. Also, note the non-standard shape of Erin's desk - that's a Visio stencil.

Using text and colour from Power BI meant that if there is no data for a specific shape in the current filter context, it disappears from the visual (white or default fill, no text). You can see this in Erin, Creed, and Andy’s desks for season 1.

One limitation of this approach was that with the text values for people’s names coming from Power BI, which doesn’t support shape text font, I couldn’t customize the text to use Courier New. Keeping them as Segoe UI is probably optimal given the small size in my case.

Also, using Visio objects also gives access to the rich library of Visio shapes – this isn’t something that I would expect to find in other potential solutions. An example of this is the shape of Erin’s desk.

A possible reliability issue
Either the shape data graphics or the linking of the shapes and data fields seemed to intermittently fail, with shape colouring remaining in Power BI, but any elements not in the Power BI dataset going dark blue (instead of the fill colour white), and text labels (using Visio shape data graphics) disappearing. This issue appeared in the visual on Power BI Desktop which persisted when I’d published to the web. I could not work out what was causing this, and changing and saving after making sometimes trivial changes resolved the issue. I suspect it could be some sort of caching in the Power BI visual.

How this could be taken further
I’ve used a layout that makes the text too small to easily read. The Visio visual has a setting to automatically zoom into the selected shape(s), however I wanted the entire floor plan to be visible so didn’t enable this.

Also, I linked character names as IDs and assumed nobody moved position or was replaced. This isn’t correct. Using IDs tied to each desk would be a more true-to-life identifier, with the character name and lines/sentiment as fields in the values field-well.

Conclusion
The Visio visual for Power BI is a powerful tool for the use-case where a flowchart or floorplan needs to be included in a Power BI report. It’s a niche case, but I’m glad to have a good tool if that need ever comes up.

Wednesday 16 September 2020

Power BI - Slowly Changing Dimension Markers, while Auto Date/Time is On

While I was working on a Power BI model, the time it took to refresh increased drastically. I’ve been working on loading historical records into a Power BI model as a Type 2 Slowly Changing Dimension. In this post I talk about why using the special null replacements commonly used in Type 2 Slowly Changing Dimensions can be a hazard with default Power BI settings.

Type 2 Slowly Changing Dimensions

If you’re not familiar with the term Type 2 Slowly Changing Dimension, it’s a modelling technique used to record copies of data as it has changed over time. In a type 2 SCD, when a change is made in the original data source, it is not updated in the copy. Instead, two additional columns are added to the copy, a “start date” and “end date” for that version of the row. When an update is made, the latest existing row is flagged as “No longer active” by setting the finish date, and a new row is added with the current date as the start date, indicating the new state of the data.

This lets us identify what was the data in the row at a certain time, and when changes were made.

Because we often want to be able to filter against both the start and end dates, for example “which customers currently live in Southland”, we don’t want a null start date or end date.

In SQL Server, I use 31st December, 9999 as the latest row’s finish date, and 1st January, 1900 as the earliest row’s start date. This means I can filter for versions of the rows that were active at a certain date and/or time.

Implementing a Type 2 Slowly Changing Dimension in Power BI

I didn’t think much of a PowerQuery step to replace null start and end date times with 01/01/1900 and 31/12/9999 respectively.

I later found the refresh time for my Power BI model felt unacceptably long on my development workstation. It’s a big model, and I put it down to recently added tables.

I’m starting to get to grips with DAX Studio, so I used the View Metrics feature of the application to see whether there were any columns in my model I could trim down in precision or distinct values, but was surprised to note the local date tables, starting with “LocalDateTable_”, consumed most of the model size, and the number of unique values in two of them were huge - the start and end dates of the type 2 SCD table.

DAX Studio told me the minimum value for the Date column of the local date table was 01/01/1900, and the maximum was 31/12/9999, and it had a very large number of rows.

An example


  1. Create a table like below.
  2. Use ReplaceValues to replace the nulls with the minimum / maximum dates
  3. Select Save and Apply.

Note that before the above replace values step is added, the data file is tiny (45KB). After, it is much larger (26MB).


Whenever we have a date or datetime column in Power BI, and have the "Auto Date/Time" feature turned on, Power BI creates a separate hidden table of dates for each date column. This is so date time intelligence, and graphs that show dates, function properly.

In my screenshot above, the range of values (with the replaced nulls with special values) are from 01/01/1900 - 10/01/2020 in one column, and 10/01/2020 - 12/31/9999 in the second. In response, it created two date tables, one with 44,195 rows, and another with 2,914,635 rows, each holding the number of days in the respective years.

I used the below query to get these figures.

EVALUATE SUMMARIZE('LocalDateTable_5f4576c5-f0ec-4966-8499-2c0f7a8b3505'

    "Rows", COUNT('LocalDateTable_5f4576c5-f0ec-4966-8499-2c0f7a8b3505'[Date]),

    "Min Date", MIN('LocalDateTable_5f4576c5-f0ec-4966-8499-2c0f7a8b3505'[Date]),

    "Max Date", MAX('LocalDateTable_5f4576c5-f0ec-4966-8499-2c0f7a8b3505'[Date])

)


The two local date tables held 196.94806MB of data, according to the “Col Size” column in View Metrics (Vertipaq Analyser) feature in DAX Studio.

Here's the before shot,


Here's the after shot.


One question that I do still have, I can't see why my table's “Version #” column is so large in the first screenshot, but so much smaller in the second - the "StartDate" and "EndDate" columns from the same table don't have that behavior. In both the before and after, this column holds only the two rows, values “a” and “b”.

With the large local date tables, the loading time of this basic dataset also went up from 3 to 9 seconds with the additional couple of millions of rows in those local date tables.

Interpretation

Okay, I’ve heard that large data models should have a custom date table, but I’ve never seen a reason why. Here it was made very clear to me - using a local date table for a large range of values will slow down my reports. I expect adding a lot of date columns will too.

Response

In response to the above, I’ve added a custom date table, marked it as the date table, and set up relationships to it from my date columns. I’m also becoming more fluent in DAX, so feel more comfortable using a role-playing (single) date table, and using deactivated relationships in my DAX expressions to use the right relationships when querying.

I’m going to still keep using LocalDateTables when I’m working with a simple dataset without large ranges of dates.

More Information

I’ve since discovered a great video on this by Guyinacube at REDUCE Power BI dataset size by 60% with ONE CHECKBOX???. See that video for information on how to turn off Auto Date/Time functionality for a report, or for all new reports you create in Power BI Desktop.

Tuesday 14 April 2020

T-SQL Tuesday #125 - Unit testing databases - How I Found Value in Unit Testing a Complex Database Procedure


I’m writing this post as a response to Hamish Watson’s T-SQL Tuesday #125 invitation. Hamish’s question is this: is unit testing valuable for implementing in databases?

I'd like to write specifically about two places I’ve considered implementing unit testing: a complex data cleanup procedure, and the mass of stored procedures behind SQL Server Reporting Services reports. I believe that unit testing is absolutely required for a large complex process, and encourages several good practices as a side-effect. In the day-to-day development of the stored procedures behind SSRS reports, I’m less sure of the value of a comprehensive suite of unit tests.

When I started working as a junior SSRS developer nine years ago, I didn’t have any notion that unit testing was a thing. The reports ran just fine, and I fixed them where any errors occurred. There was no need to write a separate piece of code after I’d written a report to validate that it worked. Because the queries were hard-coded into the reports, there was also no way to do any sort of database unit testing, so that wasn’t a concern.

Below I’ve tried to document the phases of my relationship with unit testing my database code, and why I don’t write unit tests for the stored procedures behind SSRS reports.

Phase #1. Discovery, and my response

I’ve worked with application developers who chose not to unit test. When I learned about the importance of unit testing in software development from the outside world - a talk by Hamish Watson, YouTube, blog posts etc, 

I believed it was a given that developers should be writing unit tests. I felt like the developers I worked alongside were not fulfilling their jobs properly. I remember one instance where testing would have helped detect that a feature was nonfunctional earlier, instead of the days or weeks it took to identify. In my newfound understanding of unit testing, they were supposed to be in a position to show me how to write unit tests.

I remember one short conversation between myself and that team about unit testing and situational awareness, where one of the developers looked at me perplexed and maybe slightly disgusted. I don't remember what communication happened in that conversation, but looking back I expect the way I communicated in that conversation was not helpful, or on reflection, fair.

At some point, I realised that I needed to stop beating the drum regarding my conviction that they should be doing unit tests, but I, as a database and reports developer, didn’t need to. I suspect that was in 2017, my Google search history shows that I watched TDD for those who don't need it in that year, a talk I highly recommend, which challenges the mentality I had.

Phase #2. Failure managing a complex data cleansing project.

In 2017 I was tasked with a massive data quality improvement cleanup project. There were many duplicate records in a master table for one of our systems, with many dependencies. Several of them were in tables for areas of that system that I wasn’t familiar with, areas which I barely understood. This level of complexity was far outside of my previous experience.

First I started designing a process that merged duplicate records from the bottom-up using a batch-based approach so that it was fast, fixing all rows in each of the tables in the lowest-levels first then working up, but when I realised that sometimes the parent objects wouldn’t exist under the entry I wanted to merge a duplicate into, I stopped, threw-out the bottom-up progress, and started working top-down. 

Because I wrote much of the procedure from a top-down approach, it took a long time to see results and get any outside feedback. If one of those statements was poorly coded, or a nuance had been overlooked, I could be causing some significant damage, and I might not notice it for days, weeks, or months after the problem had been introduced, likely by reports from the end users who knew the data best.

It was seriously painful for those around me who were waiting on that project to complete - the problem was causing duplicate rows to show on the UI, prevented a process change, and required the developers implement some complex workarounds that I didn’t understand to hide the data quality issue during the months that I was working on this. The flip-flop in architecture and the delays were the result of, in part, knowing how serious this code was, and how unlikely it was that all of my code would just work when I eventually hit that execute button. This anxiety was added to by not being able to hold a picture of the whole system in my head due to its size.

During the development of this system, I became a fan of the television show Can’t Pay We’ll Take it Away, as the task that I’d already sunk so much company time into was beginning to be chronically over-schedule. I also put in some serious overtime to try to get that project complete. I need to note that I felt a significant moral obligation to get this done, rather than scared, and the overtime put in was not requested by my employer.

Phase #3. Regaining control using tSQLt.

I remember working on this project on the afternoon of December 25th, 2018, thinking working on this project was the same thing I had been doing the afternoon of that day a year earlier, and it no longer seemed cool, at all. I needed to find a better way to work. Something more sustainable, that would help me make verifiable progress. I recognised that unit testing could provide that. I need to note that this project wasn’t the only thing I did that year, this work was mostly sidelined by other tasks during business hours.

After watching the Pluralsight course Unit Testing T-SQL Code with tSQLt by Dave Green on the SQL tSQLt testing suite, I implemented tSQLt tests for all of the components of the data cleanup procedures. Some of the tests were written using TDD, and other tests written after-the-fact. This pulled up mistakes, and I fixed those, until the tests all passed. It found a good crop of mistakes early on in procedure development. I love how easy tSQLt is to use to build test suites with, and appreciated being able to see actual vs expected variations in the test outcome.

More significantly, writing unit tests gave me the confidence that I needed when it came to clicking  that green triangle on the execute button. Knowing that I had thoroughly tested the individual components gave me some confidence that it would function as a whole.

tSQLt doesn’t support linked servers, so I did need to move databases and remap synonyms to references in those databases, and there were some loopback issues that came up later in dry runs, but those were the limited final pieces on the end of the testing process.

During that project I also learned the importance of modularization, in my case using inline TVFs, to reduce code complexity, and reduce lines of code. This helped speed up the development of both the unit tests and the actual stored procedures. The practice of breaking complex stored procedures into smaller more testable blocks of code is also a good pattern that the work implementing unit testing reinforced to me.

I still chose to run the merge procedures before daylight, and over several days, but none of the code I had written and tested needed redone, and none of the critical failure I was concerned with eventuated. I was glad to see the project complete without significant data damage, If you ignore the serious schedule overrun, and a minor incident around which fields to keep in one table for a merge conflict.

Phase #4. Post-project, returning to business as usual

I work with over 200 SQL Server Reporting Services reports, and the volume of reports and the wide range of other responsibilities my team is tasked with, has resulted in limited capacity for ownership, instead falling back on taking tickets and responding with a report, without a good understanding of the reports that have already been produced. This has led to some unhelpfully specific reports, some essentially duplicate, and some reports that have not fulfilled their need for a long time, but still get enough user hits for them to show as in use and avoid being pruned away. In other terms, the reports have been regarded as somewhat disposable.

A side-effect of this is that the SQL queries behind these reports are hardcoded into the reports. At 2019’s SQL Saturday in Christchurch, a panel with Hamish Watson and Greg Low advocated unanimously for getting SQL out of hardcoded queries in SSRS reports, and into stored procedures, so they can be validated. We’ve invested some work in pulling the queries out into their own stored procedures, and getting those stored procedures under source control. Now we’re down to a very nice 0 Errors, and a few warnings in our source control project. We now get a warning if we reference an object that doesn’t exist. It is an easy way to make a change to where an external synonym points, and get quick notice if that object isn’t recognised. This helps me have some confidence the reports we do have under source control will run when requested.

Writing unit tests for all of the 200+ stored procedures behind these reports, as we interact with them, seems like unnecessary overhead. It would tell us if the output changes unexpectedly, but enough test data to handle the different edge cases and paths in the reports seems like a lot of resource that we don’t have right now. The SSDT database project warns about invalid object references, which I have found to be a great value for detecting broken reports.

We don’t often have report failures causing us to scramble, needing rework due to poorly code quality or invalid references. Users are somewhat happy to tell us when reports aren’t behaving in the way they expected, and these deviations are usually due to a difference in understanding between the user and the person who wrote the report.

I do believe knowing if code is in error is a key element of situational awareness, alongside good monitoring infrastructure. We have our reporting stored procedures in an SSDT project with no errors; this doesn’t test that the procedures are functional and operating correctly, as unit tests would, but it gets most of the way there with little effort needed to maintain. Adding unit tests would tell us if a stored procedure has deviated from known good behavior, given a known input and output, so I do see some value there.

Why I do not have unit tests for the stored procedures behind my SSRS reports

We are not facing an issue regarding the reliability of the existing report code. The issue we do have is that we don’t have coherency over our enterprise reporting solutions. Users don’t know where to find reports, or which ones to trust for their particular need. That is where we need to be investing resources right now - learning what needs each report fulfills, and learning how we can better facilitate our users’ need to find the information they’re looking for, over our various solutions.

Back when I started, when I was starting out as a database and report developer, I had nothing else on my plate. I could focus just on writing reports, maybe I could have implemented unit testing then. Now, I’m learning how to be a somewhat acceptable manager to my direct report, improving workflow, optimising use of the BI/reporting solutions, producing BI work, and managing other database-related priorities. I am also now responsible for influencing the patterns of those who work around me, so maybe I should be doing it to encourage them.


Summary

I’ve seen the wonders of unit testing with a big-bang complex project, but in the slow burn of day-to-day report development, I feel that the competing priorities need my focus more. I’d like to do unit testing of my reporting stored procedures, but I don’t think implementing this is my highest need right now.